Why AMD is a Smart Investment for the Future

Advanced Micro Devices (AMD) has positioned itself as a dominant player in the semiconductor industry, benefiting from rapid advancements in AI, data center expansion, and competitive product offerings. As per recent financial data and market analysis, AMD presents a compelling investment opportunity in 2025. This article explores why AMD remains a solid buy, supported by strong growth prospects, expanding margins, and a robust balance sheet.

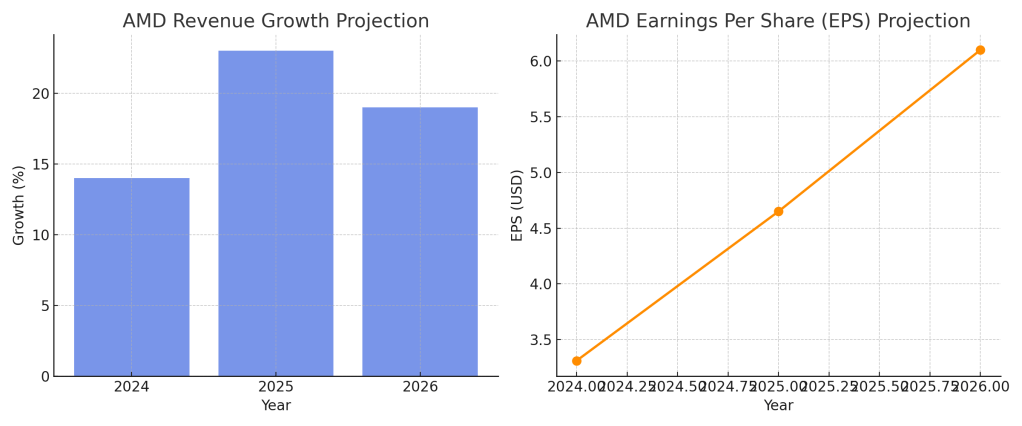
Strong Revenue and Earnings Growth AMD’s financial performance continues to gain momentum. Revenue is projected to grow by 23% in 2025 and 19% in 2026, following a 14% increase in 2024. The company’s earnings per share (EPS) estimates indicate a rise from $4.65 in 2025 to $6.10 in 2026, showcasing robust earnings growth. A significant contributor to this success is the data center segment, which is expected to see a 69% growth due to higher cloud capital expenditures and increasing CPU server market share.

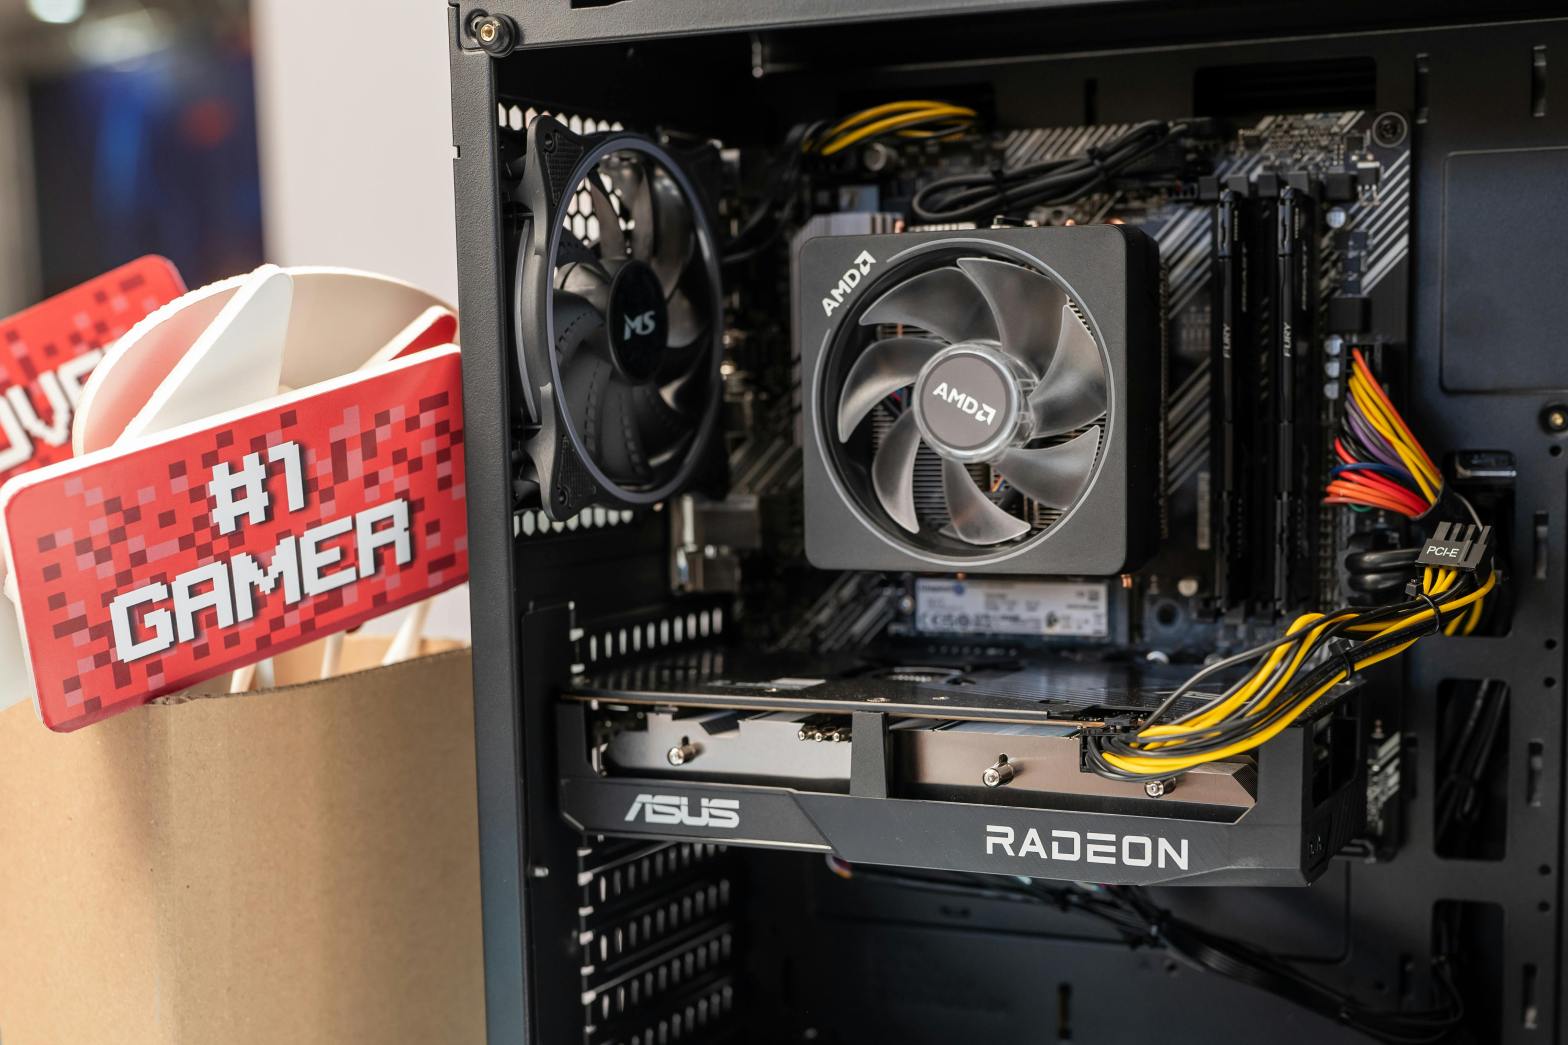
Expanding AI and Data Center Market AMD is capitalizing on the rapidly growing AI market, with a projected $8 billion in GPU sales for 2025, up from $5 billion in 2024. The launch of next-generation products like MI325x/MI350x GPUs and Turin CPUs is expected to drive further adoption among major cloud providers, including Microsoft and Meta. Additionally, AMD’s acquisition of ZT Systems enhances its ability to offer comprehensive AI and data center solutions, further strengthening its competitive position against rivals like NVIDIA and Intel.

Margin Expansion and Improved Profitability Gross margins are expected to expand from 53% in 2024 to 54% in 2025 and 56% in 2026. This improvement is driven by increased sales of high-margin products within the Data Center and Embedded segments. As AMD scales production and shifts its focus toward AI and high-performance computing, profitability will continue to rise.

Solid Balance Sheet and Free Cash Flow Growth AMD maintains a healthy balance sheet with a net cash position and rising free cash flow (FCF). The company is projected to generate $6.5 billion in FCF in 2025 and $7.5 billion in 2026, up from $2.4 billion in 2024. This financial strength provides AMD with ample flexibility to invest in innovation, acquisitions, and shareholder returns.

Competitive Positioning and Product Innovation AMD’s EPYC server processors continue to gain market share, challenging Intel’s dominance in the CPU space. Additionally, AMD is rapidly evolving its AI accelerator roadmap, with the MI400 series planned for 2026. This focus on AI hardware, combined with its ROCm software advancements, positions AMD to benefit from the broader AI infrastructure expansion.

Favorable Valuation and Upside Potential With a 12-month price target of $140, AMD is trading at an attractive valuation. The stock is valued at 22.9x its 2026 EPS estimate, which is below historical levels and presents a compelling entry point for investors. Given the anticipated earnings growth and expansion in AI markets, AMD’s stock has significant upside potential.

Risks to Consider While AMD remains a strong investment, investors should be mindful of risks such as competition from Intel and NVIDIA, potential economic slowdowns affecting demand for computers and servers, and pricing pressures in the semiconductor industry. However, AMD’s continuous innovation and expanding presence in AI and data centers mitigate these risks effectively.

Conclusion AMD’s strong revenue growth, expanding AI and data center market presence, improving margins, and solid financial position make it a highly attractive investment in 2025. With accelerating demand for AI accelerators and next-generation processors, AMD is well-positioned for sustained long-term growth. Investors looking for exposure to the semiconductor industry and AI-driven expansion should strongly consider adding AMD to their portfolios.

Wells Fargo (WFC): Navigating a Complex Landscape

Wells Fargo & Company (WFC), a prominent player in the U.S. banking sector, faces a dynamic operating environment. This analysis delves into the company’s recent performance, financial health, and future prospects, drawing insights from the provided stock report.  

Financial Performance and Outlook:

  • Revenue Growth: While revenue reached $82.55 billion in 2024, growth has been moderate.
    • Q3 2024 saw revenue of $20.36 billion, reflecting challenges from rising funding costs and loan contraction.
    • The stock report highlights that revenue growth may be impacted by low-single-digit loan contraction and rising funding costs due to shifting deposit patterns.
  • Earnings:
    • 2024 EPS is projected to reach $5.47, a slight increase from the prior year.
    • Q3 2024 EPS of $1.51 exceeded expectations but was impacted by a decline in net interest income.
  • Credit Quality: Credit quality has shown signs of deterioration, particularly in the commercial real estate sector.
  • Capital Strength: WFC maintains a strong capital position with a CET1 ratio of 11.3%, exceeding regulatory requirements. This strong capital position provides a buffer against potential economic headwinds.

Key Financial Drivers:

  • Net Interest Income (NII): Rising interest rates initially boosted NII, but increasing deposit costs have begun to erode margins. The stock report indicates that NII fell 11% year-over-year in Q3 2024 due to rising deposit costs and loan contraction.
  • Loan Growth: Loan growth has been moderate, impacted by factors such as economic uncertainty and increased competition.
  • Investment Banking: Investment banking income has shown strength, driven by strong debt underwriting activity.  

Industry Dynamics:

  • Rising Interest Rates: The impact of rising interest rates on net interest margins remains a key concern.
  • Economic Uncertainty: The potential for an economic slowdown could significantly impact loan demand and increase credit risks, particularly in sectors like commercial real estate.
  • Intense Competition: The banking sector is highly competitive, with numerous players vying for market share. This necessitates continuous innovation, operational efficiency, and a strong customer focus.
  • Regulatory Scrutiny: WFC continues to navigate regulatory challenges and address past issues, which can impact its operational flexibility and profitability.  

Analyst Views:

  • Mixed Ratings: Analysts hold a range of views, reflecting the complexities of the operating environment. Some analysts express optimism about WFC’s improving operating environment and its ability to navigate challenges. Others express concerns about potential economic headwinds, credit quality deterioration, and the impact of rising interest rates on profitability.
  • Price Targets: Analyst price targets range from $10.00 to $29.00, reflecting the diverse range of opinions on the company’s future prospects.
  • Key Risks: Key risks identified by analysts include:
    • Rising interest rates and their impact on net interest margins.
    • Economic downturn and its potential impact on loan demand and credit quality.
    • Intensifying competition within the banking sector.
    • Potential for further regulatory scrutiny.
    • Deterioration in credit quality, particularly in the commercial real estate sector.

Peer Comparisons:

WFC’s performance is often compared to peers such as:

  • Bank of America (BAC)
  • Citigroup (C)
  • JPMorgan Chase (JPM)

These comparisons help assess WFC’s relative strengths and weaknesses in areas like:

  • Revenue growth
  • Profitability
  • Efficiency
  • Credit quality
  • Market share

Conclusion:

Wells Fargo faces a complex operating environment with both challenges and opportunities. While the company has made progress in addressing past issues and improving its financial performance, uncertainties remain regarding the economic outlook and the impact of rising interest rates. Investors should carefully consider these factors and conduct thorough due diligence before making investment decisions in WFC.

Delta Air Lines: Is It a Good Investment in 2025

Introduction
Delta Air Lines (DAL), a major player in the U.S. aviation industry, operates on a hub-and-spoke model with a significant presence across domestic and international routes. This analysis explores the potential of DAL as an investment for 2025, leveraging financial metrics, industry trends, and company strategies detailed in their latest stock report.


Positive Indicators for Investment

  1. Revenue Growth and Resilience
    DAL’s revenue is projected to grow 4.6% in 2024 and 1.5% in 2025, driven by its premium travel segment (+4.4%) and loyalty rewards programs (+8.4%). Despite international demand normalizing, domestic travel trends remain robust, supported by a resilient U.S. consumer base.
  2. EPS and Margin Expansion
    The EPS forecast for 2025 is $7.42, up 23% from 2024, reflecting improved utilization rates and reduced fuel costs. While labor and maintenance costs are expected to rise, DAL’s efforts in operational efficiency aim to expand EBIT margins from 9.4% in Q3 2024 to 12% by 2025.
  3. Strategic Advantages
    • Premium Pricing Initiatives: Delta focuses on premium offerings that cater to high-income consumers, mitigating price sensitivity in its revenue mix.
    • Refinery Operations: By owning a refinery, Delta mitigates fuel price volatility, enhancing cost control.
    • Corporate Travel Recovery: With expectations of increased business travel in a favorable economic climate, DAL could gain a competitive edge.
  4. Valuation Appeal
    DAL’s stock trades at a forward P/E of 11x, below its historical averages but reflecting confidence in its long-term recovery. The 12-month target price of $82 represents a 20% upside from its current valuation.
  5. Financial Stability
    • Free cash flow (FCF) estimates for 2025 are conservatively pegged below $3 billion, supporting the company’s leverage reduction goals.
    • Debt management remains a focus, with a target to reduce gross leverage to 1.0x.

Risks and Challenges

  1. Economic Sensitivity
    The airline industry is highly sensitive to economic cycles. A recession could significantly impact discretionary travel spending and load factors.
  2. Operational Costs
    Labor and maintenance costs are set to rise, compounded by new aircraft deliveries. Despite falling fuel prices, this may pressure profit margins.
  3. Competitive Dynamics
    Intense price competition, particularly in the leisure segment, could limit revenue growth. Delta’s reliance on premium pricing may shield it somewhat, but broader industry trends remain a concern.
  4. Aircraft Delivery Delays
    Supply chain challenges, especially with Boeing, could disrupt fleet modernization plans, increasing reliance on older, less efficient aircraft.
  5. Geopolitical and External Risks
    The airline industry is exposed to geopolitical events, fluctuating oil prices, and unforeseen disruptions like pandemics or natural disasters.

Industry Landscape

Delta operates in a highly competitive and capital-intensive industry. U.S. airlines generated $221 billion in 2023, with Delta commanding a 24% market share. While domestic demand is projected to stabilize, international routes, especially trans-Atlantic, are expected to grow modestly. Equipment shortages and infrastructure constraints could cap capacity recovery in 2025.


Conclusion: Investment Outlook

Delta Air Lines offers a promising investment opportunity for 2025, bolstered by strategic initiatives, resilient domestic travel demand, and strong financial management. While risks such as economic downturns and rising costs exist, Delta’s premium positioning and cost management strategies position it well for long-term growth. For investors seeking exposure to the airline industry, DAL represents a balanced risk-reward profile with potential for significant upside. However, monitoring macroeconomic indicators and industry trends will be crucial to navigating this investment.

SkyWest: A Strong Regional Airline with Compelling Investment Potential

SkyWest, Inc. (NASDAQ: SKYW), the parent company of SkyWest Airlines and SkyWest Leasing, operates a fleet of nearly 500 aircraft that connect millions of travelers to over 200 destinations across North America. Emerging from the pandemic as the strongest American regional airline, SkyWest has demonstrated improved asset utilization, leading to revenue growth and margin expansion.

Investment Thesis

Despite operating in a mature industry, SkyWest has multiple growth opportunities. The company expects to receive 100 additional 65-76 seat aircraft from its mainline partners. SkyWest has also effectively monetized its fully depreciated CRJ-200 fleet through initiatives such as SkyWest Charter and its partnership with Contour.

SkyWest’s strong balance sheet, improving pilot staffing, and potential for margin and free cash flow growth make it a compelling investment opportunity. The company’s recent financial performance supports this outlook.

Recent Results

SkyWest reported Q1 2024 revenue of $804 million, up 16.2% year-over-year, driven by increased flying contract rates and higher production. Operating margins improved to 12.4%, surpassing analyst expectations. Block hours for the quarter increased by 4.9% year-over-year.

Strong Financial Position

SkyWest’s balance sheet is robust, with a net leverage ratio of 3.6x, down from 4.9x six months ago. The company owns 41% of its 475 aircraft outright and expects to fully pay off debt associated with its E175 fleet by 2026. This improved financial position will likely enhance free cash flow and enable shareholder returns through stock buybacks.

Outlook and Valuation

SkyWest is expected to experience a multi-year improvement in margins and free cash flow as pilot staffing improves and debt obligations decrease. The company authorized a share repurchase plan in May 2023 and is likely to renew and increase this authorization.

Consensus EPS estimates for SkyWest are $6.56 in 2024 and $7.56 in 2025, implying a forward P/E ratio of 10.6x. Historically, SkyWest has traded at low double-digit P/E multiples during growth cycles. Given the company’s positive outlook and historical performance, SkyWest’s current valuation is reasonable.

Conclusion

SkyWest has navigated recent industry challenges effectively, positioning itself as a best-in-class operator with strong growth prospects. While there are inherent risks, such as pilot shortages, economic weakness, and geopolitical uncertainties, SkyWest’s solid financial position and growth opportunities make it a compelling investment. As such, I rate SkyWest shares a ‘buy’ and recommend adding on any short-term dips.SkyWest: A Strong Regional Airline with Compelling Investment Potential

American Airlines (AAL): Navigating Turbulence

A Deep Dive into the Stock Report

American Airlines Group Inc. (AAL), a major player in the U.S. airline industry, faces a complex operating environment. The recent stock report provides a snapshot of the company’s financial performance, industry dynamics, and analyst perspectives.

Financial Performance and Outlook

  • Revenue Growth: While revenue has shown some recovery from the pandemic, reaching ~$53 billion in 2023, concerns remain about slowing demand growth in 2024 and 2025.
    • Q3 2024: Revenue of $13.65 billion, a modest 1.2% year-over-year increase.
    • 2024 Guidance: AAL expects revenue growth of 1.6% in 2024 compared to 2023.
  • Earnings Volatility:
    • Q3 2024: Adjusted EPS of $0.30, below the prior year’s $0.69.
    • 2024 Guidance: AAL anticipates full-year 2024 EPS to be in the range of $1.35 to $1.60.
  • Cost Pressures:
    • Fuel Costs: A significant expense for airlines, fuel costs can fluctuate significantly, impacting profitability.
    • Labor Costs: AAL faces increasing labor costs due to recent union contracts, including a 46% pay increase for pilots over the next four years.
    • Maintenance Costs: Delays in aircraft deliveries have forced AAL to rely on older, less fuel-efficient planes, leading to higher maintenance expenses.
  • Debt Burden:
    • Total Debt: As of June 30, 2024, AAL had $39.4 billion in total debt, a significant financial burden.
    • Debt-to-EBITDA: AAL’s total debt to EBITDA was 4.0x as of June 30, 2024.

Industry Dynamics

  • Intense Competition: The airline industry is fiercely competitive, with numerous players vying for market share.
    • Price Wars: Intense price competition can erode profitability for all airlines.
    • Overcapacity: Periods of overcapacity can lead to lower fares and reduced revenue.
  • Economic Sensitivity: Air travel demand is highly sensitive to economic conditions. A recession could severely impact AAL’s revenue and profitability.
  • Geopolitical Risks: Global events, such as geopolitical instability and disease outbreaks, can disrupt travel patterns and impact demand.

Analyst Views

  • Mixed Ratings: Analysts hold a range of views on AAL, with some expressing concerns about the company’s high debt levels and volatile earnings. Others see potential for growth as travel demand recovers.
  • Price Targets: Analyst price targets range from $10.00 to $29.00, reflecting the uncertainty surrounding AAL’s future prospects.
  • Key Risks: Analysts highlight several key risks, including:
    • Rising fuel costs
    • Economic recession
    • Labor disputes
    • Further delays in aircraft deliveries

Peer Comparisons

AAL’s performance is often compared to its major competitors, such as:

  • Delta Air Lines (DAL)
  • United Airlines (UAL)

These comparisons can provide insights into AAL’s relative strengths and weaknesses, such as:

  • Revenue growth rates
  • Profitability margins
  • Debt levels
  • Market share

Conclusion

American Airlines faces a challenging operating environment with a mix of opportunities and risks. Investors should carefully consider the company’s financial performance, industry dynamics, and analyst perspectives before making investment decisions.

United Airlines: Undervalued Stock with Strong Financial Position and Potential for Capital Returns

United Airlines Holdings, Inc. (NASDAQ: UAL) recently reaffirmed its strong Q2 guidance, projecting an EPS target of $10 for the year. Despite this positive outlook, the stock has slumped, presenting a potential buying opportunity for investors.

Investment Thesis

United Airlines’ stock is currently undervalued, trading at only 4x EPS targets, despite a strong financial position. The company has $14 billion in cash, $40 billion in property, plant, and equipment (PP&E), and net debt of only $13 billion. This financial strength positions United Airlines to potentially start returning capital to shareholders through share buybacks, signaling confidence in the company’s future.

Strong Financial Position

United Airlines ended Q1 with $14 billion in cash and $40 billion in PP&E. While the debt level is nearly $27 billion, the net debt position is only $13 billion, reflecting a strong balance sheet. The company produced $7 billion in operating cash flow last year and is expected to generate similar amounts this year, which can be used to acquire aircraft or pay down debt.

Comparison to Peers

Interestingly, Royal Caribbean Cruises Ltd. (RCL) has a similar EPS target of $10+ for the year but trades at three times the price of United Airlines. Despite United Airlines’ stronger financial position, the stock remains undervalued compared to the cruise line industry.

Potential for Capital Returns

United Airlines has hinted at the possibility of starting a share buyback program after repaying $1.8 billion in high-cost debt. This move would signal confidence in the company’s future and could significantly boost the stock price. While Delta Air Lines (DAL) has recently reinstated a minimal dividend, United Airlines’ stronger balance sheet and cash flow position it well for substantial capital returns.

Valuation and Market Sentiment

The current market sentiment appears to misunderstand United Airlines’ financial strength. The stock’s low valuation, despite a robust EPS target and strong cash flow, indicates a market disconnect. Investors should focus on the company’s ability to generate cash flow and its potential to return capital to shareholders.

Conclusion

United Airlines is in a strong financial position with substantial cash reserves, a manageable debt level, and a significant PP&E balance. The company’s reaffirmed EPS guidance and potential for share buybacks make it an attractive investment opportunity. Trading at only 4x EPS targets, United Airlines stock is undervalued and presents a compelling buy for investors looking for value in the airline sector.

Recommendation

Given the strong financial outlook, potential for capital returns, and market undervaluation, I rate United Airlines Holdings, Inc. stock as a ‘Buy.’ Investors should consider adding the stock to their portfolios, particularly on any short-term dips.

Leggett & Platt: Investment Opportunity Amidst Challenges

Recent Performance and Market Reaction

Leggett & Platt (NYSE) has experienced a significant decline over the past three years, with its share price plummeting over 80%. The recent dividend cut, after maintaining a consistent payout for 53 years, further exacerbated the decline, causing an additional 25% drop in share value. The company’s struggles are primarily due to weakened industry conditions and increased low-cost competition from overseas, leading to a decline in revenue and margins. Despite these challenges, the current low share price presents a potential buying opportunity for long-term investors.

Industry Challenges and Revenue Decline

The bedding, furniture, and flooring materials industry, which constitutes the bulk of Leggett & Platt’s revenue, has been hit hard by slowing home sales. Rising interest rates since 2022 have reduced turnover in the housing market, directly impacting consumer demand for home furnishings. As a result, the company’s annual revenue is expected to drop to around $4.5 billion in 2024, down from $5.1 billion in 2022.

Competition and Margin Pressures

Leggett & Platt faces intense competition from both domestic and international players. The company’s operating margins have compressed, with a 7% decline in sales volume in 2023. Additionally, interest expenses are set to increase due to a $300 million 3.8% senior note maturing in November, which will be refinanced at higher rates.

Management Changes

Mitch Dolloff, the CEO since 2021, stepped down following the dividend cut announcement in Q2 2024. He is being replaced by Karl Glassman, the previous CEO from 2016-2021, who has been with the company since 1982. This leadership change aims to stabilize the company during these challenging times.

Comparative Industry Performance

Other companies in the industry, like Sleep Number (SNBR) and Purple Innovation (PRPL), have also seen declines in revenue and profitability. However, Tempur Sealy International Inc. (TPX), the market leader, has managed to maintain stable sales due to its strong brand presence and diversified product portfolio. This contrast highlights a vulnerability for Leggett & Platt, which primarily sells to other businesses rather than directly to consumers.

Valuation and Investment Thesis

Despite the challenges, Leggett & Platt’s current share price (around $11) might offer value for long-term investors. Management projects earnings of about $1/share in 2024, significantly lower than the $2-$3/share range from 2015-2022. Even with a conservative estimate, assuming continued pressure on margins and higher interest expenses, the company’s earnings power could be around $1.50/share. This implies an earnings yield of approximately 14%, which is attractive at the current share price.

Potential Catalysts

  1. Debt Reduction and Share Repurchases: Management’s commitment to paying down debt and potentially repurchasing shares at depressed prices could significantly enhance shareholder value.
  2. Industry Recovery: A rebound in the housing market would likely increase demand for the company’s products, improving revenue and margins.
  3. Segment Performance: The “Specialized Products” segment has shown revenue growth as supply chain disruptions ease, indicating potential for recovery in other segments as well.

Risks and Considerations

  • Competition and Innovation: Leggett & Platt must stay competitive by controlling costs and investing in R&D to prevent market share erosion by competitors.
  • Economic Uncertainty: Prolonged weakness in the housing market or further economic downturns could delay recovery and impact profitability.

Insider Confidence

Recent insider purchases totaling over $750K indicate a belief in the company’s recovery prospects. This insider activity is a positive signal for potential investors.

Conclusion

Leggett & Platt faces substantial challenges, but the current low valuation provides a potential entry point for investors with a long-term perspective. The company’s ability to generate positive cash flow, manage debt, and capitalize on a future housing market recovery positions it for potential rebound. Patience and a focus on the company’s strategic initiatives will be key for investors looking to benefit from this opportunity.

SoFi Technologies (NASDAQ: SOFI): Strong Buy Amid Short-Term Volatility

1. Introduction: Market Dynamics and Performance

SoFi Technologies has seen a 12.5% decline since early March, underperforming the broader U.S. stock market. However, the company’s fundamentals remain robust, with strong revenue growth and expanding profitability. This report assesses recent developments, valuation, and market potential, reiterating a “Strong Buy” rating for SOFI.

2. Recent Developments

2.1. Earnings Performance

SoFi released its latest quarterly earnings on April 29, surpassing consensus revenue and EPS estimates:

  • Revenue Growth: 26.2% YoY.
  • EPS Improvement: From -$0.05 to $0.02 YoY.

Key business metrics continue to grow in double digits, indicating strong business health and long-term financial success.

2.2. Expansion and Cross-Selling Potential

SoFi is aggressively expanding its ecosystem of services, aiming to maximize cross-selling opportunities. CEO Anthony Noto and CFO Chris Lapointe have highlighted a robust pipeline of new products and services, targeting a 25% revenue CAGR over the next three years. This optimistic outlook suggests that market consensus estimates might be underestimating SoFi’s growth potential.

3. Valuation Analysis

3.1. Current Valuation

Despite a 21% price decline over the past twelve months, SoFi’s valuation remains attractive:

  • P/E Ratios: While high currently, a massive P/E contraction is expected as profitability improves.
  • Tangible Book Value (TBV): With a current TBV of $4.1 billion and an expected increase to above $5 billion by year-end, SoFi’s forward Price/TBV ratio is around 1.35. This is notably lower than the average of the three largest U.S. banks (1.79).
3.2. Upside Potential

Multiplying SoFi’s expected $5.1 billion TBV by the average Price/TBV ratio of 1.79 suggests a fair market capitalization of $9.1 billion, indicating a 32% upside potential over the next twelve months.

4. Technical Analysis

From a technical perspective, SoFi’s current share price presents a good entry point. Historical trends show that the stock rarely dips below $7 per share without subsequently rallying. The RSI indicator at 41.57 further supports a potential rebound.

5. Insider Activity

CEO Anthony Noto’s consistent buying signals strong confidence in the stock’s undervaluation and potential upside. High insider buying during price declines often indicates an optimistic outlook from those closest to the company’s operations.

6. Risks and Considerations

6.1. Volatility and Market Sentiment

Despite improving fundamentals, SoFi’s stock has experienced significant volatility. Investors should be prepared for potential short-term fluctuations and maintain a long-term perspective.

6.2. Competition

As fintech adoption grows, competition will likely intensify. European fintech giant Revolut’s expansion towards the U.S. market exemplifies potential competitive threats that could impact SoFi’s revenue growth.

7. Conclusion: Long-Term Investment Outlook

SoFi remains a “Strong Buy” due to its robust growth potential and improving financial metrics. While short-term volatility is expected, the company’s strategic expansion and cross-selling opportunities provide a compelling investment case. Long-term investors should consider the current price weakness as an opportunity to increase their positions in SOFI.

Investment Strategy:

  • Strong Buy: Investors should accumulate SOFI shares, focusing on long-term growth potential and underlying fundamentals.
  • Monitor: Keep track of competitive developments and market conditions that could affect SoFi’s performance.

In conclusion, SoFi Technologies presents a strong investment opportunity for those willing to navigate short-term volatility for long-term gains.

Boeing’s Financial Struggles: Key Insights for Investors

The Boeing Company (BA), a titan in the aerospace and defense industry, faces a complex landscape of challenges and opportunities. While known for its iconic aircraft like the 737 MAX and dominance in commercial aviation, the company has been grappling with quality control issues, regulatory scrutiny, and intense competition. This report delves into Boeing’s current standing, its financial performance, and the key factors that investors should consider.  

Recent Financial Performance (Data as of September 30, 2024 – Q3 2024)

  • Revenue: $17.84 billion  
  • Net Income: -$10.44 billion
  • Earnings Per Share (EPS): -$10.44  
  • Return on Equity (ROE): -29.6% (Trailing Twelve Months)
  • Return on Assets (ROA): -7.6% (Trailing Twelve Months)
  • Key Financial Trends:
    • Revenue: Declined due to lower commercial aircraft deliveries and challenges in the defense segment.
    • Profitability: Significant losses driven by increased costs, production delays, and charges related to the 777X and 767 programs.
    • Cash Flow: Negative operating cash flow in Q3 2024, reflecting the impact of lower deliveries and higher costs.  

Highlights

  • Revenue forecast is $82.6B in 2024: In line with the $82.6B recorded in 2023. We expect the relatively weak performance to be driven by low-single-digit loan contraction and rising funding costs due to noninterest-bearing deposits flowing into interest-bearing accounts. Still, signs of a rebound are showing up in mortgage banking income and we expect investment banking income to surge past 2021’s elevated levels as WFC takes market share and benefits from strong debt underwriting.
  • In Q3 2024, net interest income fell 11% Y/Y: As rising deposit costs led to 36 bps of net interest margin compression. Balance sheet movement was relatively weak as stable deposit balances were met with a 3% drop in loans. Looking forward, we expect loan momentum to return as results are positively impacted by loosening monetary policy, while deposits should rise modestly, in our view.
  • As of September 30, 2024, WFC was well capitalized: With a CET1 ratio of 11.3%, well above its regulatory minimum 9.8%. Given this, we expect WFC to lean on share repurchases and repurchase approximately $19B in 2024 vs. $12B in 2023. We note WFC has cut its shares outstanding by 22% over the past five years.

Investment Rationale/Risk

  • Our Buy recommendation reflects a positive view of CEO Charles Scharf: And his efforts to resolve regulatory issues. We believe WFC is in the final stages of its $1.95T asset cap (which has been in place since 2018). We also think the release of the asset cap (hopefully in 2025) will result in reputational improvement and an uptick in both loan and deposit growth. Additionally, we have been impressed with efficiency improvements as the bank has cut its physical footprint and prioritized digital (headcount down 20% over the past four years).
  • This positive view is partly offset by WFC’s above-peer-average exposure to the struggling commercial real estate office sector. Still, we commend WFC’s effort to reduce risk as the bank’s Q3 2024 commercial real estate office exposure of $29.0B is down 10% from a year ago.
  • Risks are a U.S. recession, weaker consumer or commercial loans, steeper credit losses, negative regulatory rulings, rising deposit competition, and failure to execute cost saves.

Business Summary

  • CORPORATE OVERVIEW. Wells Fargo & Co. (WFC) is a diversified financial services company with operations around the world. WFC offers investment and mortgage products and services, as well as consumer and commercial finance, through four reportable operating segments: Consumer Banking and Lending, Commercial Banking, Corporate and Investment Banking, and Wealth and Investment Management. Wells Fargo ranked No. 47 on Fortune’s 2023 rankings of America’s largest corporations. In an effort to improve the bank’s efficiency, WFC has cut its headcount to 220,000 employees in Q3 2024 from over 270,000 in 2020.  
  • LEGAL/REGULATORY ISSUES. Corporate governance and bank practices have put the company in the spotlight for many years. Various federal and state statutory provisions and regulations limit the amount of dividends that WFC’s subsidiary banks and certain other subsidiaries may pay without regulatory approval. Federal banking regulators have the authority to prohibit the parent company’s subsidiary banks from engaging in unsafe or unsound practices in conducting their businesses.
  • IMPACT OF MAJOR DEVELOPMENTS. On September 27, 2019, WFC’s board of directors announced the appointment of a new CEO after six months of uncertainty. Charles Scharf was formerly CEO of Visa Inc. and Bank of New York Mellon. Scharf has made the implementation of a risk and control framework appropriate for a bank of WFC’s size and complexity a top priority. Since 2019, regulators have terminated six consent orders.
  • FINANCIAL PROFILE. WFC stated that with $1.9 trillion in total assets, the bank thinks it can meet its customers’ financial needs and deliver growth without increasing the bank’s balance sheet in the near term. Management is focused on reducing its exposure to riskier assets. We have also seen WFC be early versus its peers in tightening its credit risk discipline for new originations in commercial real estate during a period of increased competition.
  • As of December 31, 2023, WFC’s Common Equity Tier 1 ratio was 11.4% in 2023 versus 10.6% in 2022, and 11.4% in 2021, and still above the regulatory minimum target of 8.9%. The bank’s tangible book value per share was $39.23 in 2023 versus $34.98 in 2022 and $36.35 in 2021. Its return on average tangible common equity (ROTCE) was 13.1% in 2023 compared to 9.3% in 2022 and 14.8% in 2021.
  • WFC remains subject to an asset cap as part of the Fed’s consent order. Management must prioritize balance sheet usage more so than if it was not a limitation, which is a significant competitive constraint. Though WFC believes it’s making progress, there is still work to do. We think WFC may be able to return excess capital to shareholders through a combination of higher dividends and share buybacks. Management is assuming the asset cap will remain in place throughout 2024.  
  • In 2023, revenue jumped 11% Y/Y as results benefited from a 17% surge in net interest income. Noninterest income rose 3% as gains on trading activities and a rebound in investment banking fees outweighed weakness in deposit fees and mortgage banking. At the end of 2023, total loans outstanding were $937 billion, down 2% Y/Y, while total deposits were $1.36 trillion (-2%). In 2022, credit quality was excellent, with net charge-offs coming in at just 0.17%. However, net charge-offs jumped to 0.37% in 2023 as deterioration was identified in commercial real estate and credit card loans.
  • WFC is a stable bank with multiple funding sources and credit risk management. In Q3 2024, the bank’s commercial real estate (CRE) loans represented $141 billion, or 16% of $910 billion of total loans, with office buildings at just $29 billion of loans, spread over many geographies. Nearly 80% of office borrowers are in more stable Class A properties. WFC’s allowance for credit losses was 8.3% for office loans vs. 1.62% for the whole firm.

Quantitative Evaluations

  • Fair Value Rank: 1 2 3 4 5
    • Lowest Highest
    • Based on CFRA’s proprietary quantitative model, stocks are ranked from most overvalued (1) to most undervalued (5).  
  • Fair Value Calculation: USD 67.24
    • Analysis of the stock’s current worth, based on CFRA’s proprietary quantitative model, suggests that WFC is overvalued by USD 3.87 or 5.44%
  • Volatility: LOW AVERAGE HIGH
  • Technical Evaluation: NEUTRAL
    • Since August, 2024, the technical indicators for WFC have been NEUTRAL”
  • Insider Activity: UNFAVORABLE NEUTRAL FAVORABLE

Wells Fargo’s Financial Performance and Future Outlook

Wells Fargo & Company (WFC) is a major player in the U.S. banking industry, offering a diverse range of financial services to individuals and businesses. This includes everything from everyday banking like checking and savings accounts to more complex offerings like mortgages, loans, investment products, and wealth management services.

Key Strengths

  • Diversified Revenue Streams: WFC operates across multiple business segments, reducing reliance on any single area. This diversification helps mitigate risks and provides a more stable revenue base.
  • Strong Capital Position: The company maintains a solid capital base, providing a cushion against potential losses and supporting future growth.
  • Improving Efficiency: WFC has been actively streamlining operations, reducing costs, and enhancing its digital capabilities to improve efficiency and better serve its customers.

Key Challenges

  • Regulatory Scrutiny: WFC has faced significant regulatory challenges in recent years, impacting its growth and profitability.
  • Economic Headwinds: A potential economic downturn could negatively impact loan demand, increase credit losses, and adversely affect the bank’s financial performance.
  • Competitive Landscape: The banking industry is highly competitive, with numerous players vying for market share.

Recent Financial Performance (Data as of September 30, 2024 – Q3 2024)

  • Revenue: $20.48 billion
  • Net Income: $4.85 billion
  • Earnings Per Share (EPS): $1.42
  • Return on Equity (ROE): 10.30% (Trailing Twelve Months)
  • Return on Assets (ROA): 1.00% (Trailing Twelve Months)
  • Net Interest Income: $11.69 billion (down 11% year-over-year)
  • Net Interest Margin: 2.67%
  • Total Loans: $910 billion
  • Total Deposits: $1.36 trillion

Key Financial Trends

  • Net Interest Income (NII): NII has been impacted by rising interest rates, leading to higher funding costs. The bank has been actively managing its interest rate risk, but NII remains a key area of focus.
  • Credit Quality: Credit quality has generally remained stable, although there are concerns about potential deterioration in certain areas, such as commercial real estate.
  • Efficiency: The bank has been making progress on improving efficiency through cost-cutting measures and digital initiatives.

Highlights

  • Revenue forecast is $82.6B in 2024: In line with the $82.6B recorded in 2023. We expect the relatively weak performance to be driven by low-single-digit loan contraction and rising funding costs due to noninterest-bearing deposits flowing into interest-bearing accounts. Still, signs of a rebound are showing up in mortgage banking income and we expect investment banking income to surge past 2021’s elevated levels as WFC takes market share and benefits from strong debt underwriting.
  • In Q3 2024, net interest income fell 11% Y/Y: As rising deposit costs led to 36 bps of net interest margin compression. Balance sheet movement was relatively weak as stable deposit balances were met with a 3% drop in loans. Looking forward, we expect loan momentum to return as results are positively impacted by loosening monetary policy, while deposits should rise modestly, in our view.
  • As of September 30, 2024, WFC was well capitalized: With a CET1 ratio of 11.3%, well above its regulatory minimum 9.8%. Given this, we expect WFC to lean on share repurchases and repurchase approximately $19B in 2024 vs. $12B in 2023. We note WFC has cut its shares outstanding by 22% over the past five years.

Investment Rationale/Risk

  • Our Buy recommendation reflects a positive view of CEO Charles Scharf: And his efforts to resolve regulatory issues. We believe WFC is in the final stages of its $1.95T asset cap (which has been in place since 2018). We also think the release of the asset cap (hopefully in 2025) will result in reputational improvement and an uptick in both loan and deposit growth. Additionally, we have been impressed with efficiency improvements as the bank has cut its physical footprint and prioritized digital (headcount down 20% over the past four years).
  • This positive view is partly offset by WFC’s above-peer-average exposure to the struggling commercial real estate office sector. Still, we commend WFC’s effort to reduce risk as the bank’s Q3 2024 commercial real estate office exposure of $29.0B is down 10% from a year ago.
  • Risks are a U.S. recession, weaker consumer or commercial loans, steeper credit losses, negative regulatory rulings, rising deposit competition, and failure to execute cost saves.

Business Summary

  • CORPORATE OVERVIEW. Wells Fargo & Co. (WFC) is a diversified financial services company with operations around the world. WFC offers investment and mortgage products and services, as well as consumer and commercial finance, through four reportable operating segments: Consumer Banking and Lending, Commercial Banking, Corporate and Investment Banking, 1 and Wealth and Investment Management. Wells Fargo ranked 2 No. 47 on Fortune’s 2023 rankings of America’s largest corporations. In an effort to improve the bank’s efficiency, WFC has cut its headcount to 220,000 employees in Q3 2024 from over 270,000 in 2020.  
  • LEGAL/REGULATORY ISSUES. Corporate governance and bank practices have put the company in the spotlight for many years. Various federal and state statutory provisions and regulations limit the amount of dividends that WFC’s subsidiary banks and certain other subsidiaries may pay without regulatory approval. Federal banking regulators have the authority to prohibit the parent company’s subsidiary banks from engaging in unsafe or unsound practices in conducting their businesses.
  • IMPACT OF MAJOR DEVELOPMENTS. On September 27, 2019, WFC’s board of directors announced the appointment of a new CEO after six months of uncertainty. Charles Scharf was formerly CEO of Visa Inc. and Bank of New York Mellon. Scharf has made the implementation of a risk and control framework appropriate for a bank of WFC’s size and complexity a top priority. Since 2019, regulators have terminated six consent orders.
  • FINANCIAL PROFILE. WFC stated that with $1.9 trillion in total assets, the bank thinks it can meet its customers’ financial needs and deliver growth without increasing the bank’s balance sheet in the near term. Management is focused on reducing its exposure to riskier assets. We have also seen WFC be early versus its peers in tightening its credit risk discipline for new originations in commercial real estate during a period of increased competition.
  • As of December 31, 2023, WFC’s Common Equity Tier 1 ratio was 11.4% in 2023 versus 10.6% in 2022, and 11.4% in 2021, and still above the regulatory minimum target of 8.9%. The bank’s tangible book value per share was $39.23 in 2023 versus $34.98 in 2022 and $36.35 in 2021. Its return on average tangible common equity (ROTCE) was 13.1% in 2023 compared to 9.3% in 2022 and 14.8% in 2021.
  • WFC remains subject to an asset cap as part of the Fed’s consent order. Management must prioritize balance sheet usage more so than if it was not a limitation, which is a significant competitive constraint. Though WFC believes it’s making progress, there is still work to do. We think WFC may be able to return excess capital to shareholders through a combination of higher dividends and share buybacks. Management is assuming the asset cap will remain in place throughout 2024.
  • In 2023, revenue jumped 11% Y/Y as results benefited from a 17% surge in net interest income. Noninterest income rose 3% as gains on trading activities and a rebound in investment banking fees outweighed weakness in deposit fees and mortgage banking. At the end of 2023, total loans outstanding were $937 billion, down 2% Y/Y, while total deposits were $1.36 trillion (-2%). In 2022, credit quality was excellent, with net charge-offs coming in at just 0.17%. However, net charge-offs jumped to 0.37% in 2023 as deterioration was identified in commercial real estate and credit card loans.
  • WFC is a stable bank with multiple funding sources and credit risk management. In Q3 2024, the bank’s commercial real estate (CRE) loans represented $141 billion, or 16% of $910 billion of total loans, with office buildings at just $29 billion of